
✓Trade show ROI = (return attributed to the show − total cost of the show) ÷ total cost × 100. Decide once whether “return” means revenue or gross margin, and keep it that way.
✓A widely quoted industry target is a 3:1 to 5:1 return over 12 months. Surveys that count net profit rather than revenue land closer to 25–34 %.
✓Count every cost: floor space, stand, transport, staff and travel, pre-show marketing, lead-capture tools and internal time. Half-counted costs give a flattering, useless ROI.
✓Seven levers move the number: show selection, KPIs set beforehand, stand design and flow, pre-booked meetings, live demos, on-the-spot lead qualification and a 48-hour follow-up.
What is trade show ROI? The formula
Trade show ROI (return on investment) measures what a show brought back compared with what it cost. It is the number that lets you defend an exhibition budget in front of a finance director, compare two shows and decide whether to come back next year with a bigger stand or not at all.
The formula is simple:
Trade show ROI = (Return attributed to the show − Total cost of the show) ÷ Total cost of the show × 100
Everything that follows depends on how you define the two terms. Total cost is the full bill, not just the invoice from the organiser. Return is either the revenue or the gross margin generated by contacts made at the show, tracked over a defined period, usually six to twelve months in B2B.
One rule saves most arguments: choose revenue or gross margin once, write it in your event brief, and apply it to every show. Revenue-based ROI produces headline figures of 200 % to 400 %. Margin-based ROI on the same show produces 30 % to 80 %. Both are correct; mixing them across shows is not.
ROI versus ROO
Some results never appear on an invoice: a distributor met by chance, a competitor’s launch seen up close, a journalist who now knows your name. Event marketers call this return on objectives (ROO). It does not replace the financial calculation, but it belongs in the post-show report, scored against the objectives set before the show.
What to count as cost: the full checklist
Most trade show ROI calculations are wrong on the cost side: exhibitors add the floor space and the stand, then stop. The real bill is usually 40 % to 70 % higher once staff, travel, transport and internal time are included.
| Cost line | What it includes | Typical share of budget |
|---|---|---|
| Floor space | Space rental, registration fees, compulsory insurance, catalogue entry | 15–25 % |
| Stand | Design, build, graphics, furniture, lighting, audiovisual, installation and dismantling | 35–50 % |
| Transport and logistics | Freight, handling, storage, samples, product shipping, empties | 5–10 % |
| Staff and travel | Flights or trains, hotels, meals, per diems, temporary staff, hostesses, interpreters | 10–20 % |
| Pre-show marketing | Invitations, emailing, social campaigns, press kit, printed material, giveaways | 5–10 % |
| Lead-capture tools | Badge scanner licence, lead app, CRM integration, tablets | 1–3 % |
| Internal time | Days spent by sales, marketing and management preparing, attending and following up | Often omitted, 10–15 % when valued |
The stand is the biggest single line. It is also the one you control most, which is why it deserves its own section below. If you need a detailed breakdown of what a stand costs per square metre, read our guide to exhibition stand cost before you set the overall budget.
Two lines are systematically forgotten: internal time (four salespeople away from their desks for a week have a cost, even if no invoice arrives) and post-show time (the two weeks of follow-up calls are part of the show). Include both, or state clearly that you have excluded them.
What to count as return: leads, pipeline, deals, brand
The return side has four layers. Each one is more certain than the previous, and each one takes longer to appear.
Leads. Contacts collected on the stand. Count them, but qualify them: a badge scan at the coffee machine is not a lead. Split them into qualified (matches your customer profile, has a need and a timeline) and unqualified.
Pipeline. Opportunities opened in your CRM from show contacts, with an estimated value and a probability. Weighted pipeline (value × probability) is the best early indicator of ROI, usually available four to eight weeks after the show.
Closed deals. Revenue actually invoiced to customers whose first contact, or decisive contact, was the show. This is the figure that goes into the formula. In B2B it takes six to twelve months to be complete.
Brand and relationship gains. Existing customers met, press coverage, social reach, recruitment contacts, competitive intelligence. Report them as ROO with a score against objectives, not as euros.
Orders from existing customers who visited the stand? Count only what would not have happened without the show: a renewal already agreed is not a show result, an upsell first discussed on the stand is.
How to calculate trade show ROI in 5 steps
Set objectives and KPIs before the show. Number of qualified leads, number of meetings booked, target pipeline value, target revenue at 12 months. Without a target, any result looks acceptable.
Add up the total cost using the checklist above, including internal time. Freeze that figure the week after the show; do not revise it downwards later.
Tag every contact in the CRM with the show name and year. This is the step most companies skip, and the reason they cannot calculate ROI six months later.
Track the return over a fixed window, typically 12 months. Report an interim ROI at 3 months (based on weighted pipeline) and a final ROI at 12 months (based on invoiced revenue or margin).
Apply the formula and compare against your target, against last year, and against the same budget spent on another channel. Then decide: same show, bigger stand, smaller stand, or a different show.
Three secondary ratios make the result easier to read than a single percentage:
Cost per lead = total cost ÷ number of qualified leads.
Cost per customer = total cost ÷ number of customers won from the show.
Break-even = total cost ÷ average margin per customer = the number of customers needed to pay for the show.
Break-even is the figure sales teams understand instantly: “we need eight customers from this show to pay for it” is a clearer brief than “we target 180 % ROI”.
Trade show ROI worked examples: three scenarios
The figures below use stand prices in line with what we quote for a custom stand at €600 to €1,500 per m², plus realistic costs for space, travel and marketing. Scenarios A and B are well-prepared shows; scenario C is the same stand as A with no pre-show work and a late follow-up.
| Line | A: 36 m² custom stand, Paris | B: 54 m² custom stand, Munich | C: same as A, unprepared |
|---|---|---|---|
| Floor space | €14,400 | €21,600 | €14,400 |
| Custom stand (design, build, install) | €36,000 (€1,000/m²) | €64,800 (€1,200/m²) | €36,000 |
| Transport and logistics | €4,000 | €9,000 | €4,000 |
| Staff and travel | €8,000 | €15,000 | €8,000 |
| Pre-show marketing | €4,000 | €6,000 | €0 |
| Lead-capture tools | €1,000 | €1,500 | €1,000 |
| Internal time | €4,000 | €6,000 | €4,000 |
| Total cost | €71,400 | €123,900 | €67,400 |
| Contacts collected | 180 | 260 | 120 |
| Customers won at 12 months | 20 | 30 | 6 |
| Average deal value | €12,000 | €18,000 | €12,000 |
| Revenue attributed | €240,000 | €540,000 | €72,000 |
| Gross margin (40 % / 35 % / 40 %) | €96,000 | €189,000 | €28,800 |
| ROI on revenue | 236 % (3.4:1) | 336 % (4.4:1) | 7 % (1.1:1) |
| ROI on gross margin | 34 % | 53 % | −57 % |
| Cost per contact | €397 | €477 | €562 |
| Cost per customer | €3,570 | €4,130 | €11,233 |
| Break-even (customers, margin basis) | 15 | 20 | 14 |
Three lessons sit in this table. The same stand delivers a 3.4:1 or a 1.1:1 return depending on what happens before and after the show: the stand creates the opportunity, preparation and follow-up cash it in. Revenue-based and margin-based ROI tell very different stories, so state which one you use. And the larger stand at an international show (scenario B) costs 74 % more than A but returns more per euro, because the higher deal value and denser visitor flow do the work. Size is not the risk; lack of preparation is.
To run your own numbers: cost checklist, realistic number of qualified leads, your usual lead-to-customer conversion rate, your average deal value. Break-even first, then ROI.
What is a good trade show ROI? Benchmarks
There is no single benchmark, because exhibitors do not measure the same thing. The figures below are the ones most often quoted across the exhibition industry, with the basis on which they are calculated. Use them as an order of magnitude, not as a pass mark.
| Metric | Commonly quoted range | Basis and caveat |
|---|---|---|
| ROI ratio over 12 months | 3:1 to 5:1 (200–400 %) | Revenue attributed to the show ÷ total cost. Quoted by event-software publishers (Cvent gives “four-to-one” as a common expectation) and UK stand builders citing exhibition industry bodies. |
| ROI as a net percentage | 25–34 % | Survey of 200+ marketers reported by Marketing Charts, on a net-profit basis. Consistent with the margin-based line in our worked examples. |
| Cost per lead | Around $112 (roughly €100) on average; several hundred euros per qualified lead in high-ticket B2B | Exhibitor survey figure quoted by Cvent. The average is pulled down by consumer and volume shows; what matters is comparison with your own customer acquisition cost. |
| Attribution window | 6 to 12 months | Length of a typical B2B sales cycle. Measuring at the end of the show gives a falsely negative result. |
A practical reading: revenue-based ROI above 3:1 at 12 months and a cost per qualified lead below your other channels means the show is working. Below 2:1 two years running, change the show, the stand or the follow-up before you change the budget.
The 7 levers that move trade show ROI
Across the shows we build for, the exhibitors who come back with a bigger stand share the same habits. They act on seven levers, in this order.
1. Show selection
The single biggest decision. A show where 60 % of visitors match your target profile beats a larger show where 15 % do. Ask the organiser for the audited visitor breakdown by function and sector, and check who exhibited last year and who came back. If you are choosing between shows, our trade show guides cover the main events in Paris, Cannes and abroad.
2. Objectives and KPIs set before the show
Leads, meetings, pipeline, revenue: one target for each, agreed with sales, written down. A team that knows it needs 40 qualified conversations a day behaves differently from a team told to “be welcoming”.
3. Stand design and visitor flow
The stand is where budget meets behaviour. An open front, a clear reason to step in, a demonstration point visible from the aisle, seating for real conversations and a place to store coats and samples: each of these raises the number of conversations per hour. Our page on custom exhibition stand design details how we plan flow, sightlines and meeting zones before drawing a single wall.
4. Pre-show invitations and booked meetings
Exhibitors who arrive with a full meeting schedule are not dependent on aisle traffic. Six to eight weeks out, invite customers and prospects personally, offer a slot, and follow up by phone. Pre-booked meetings typically convert several times better than walk-ins, because both sides come prepared.
5. Live demonstrations and staff briefing
A demonstration every 30 minutes gives visitors a reason to stop and a reason to stay. It also gives your team a script. Brief staff on the three questions that qualify a visitor and on who handles which type of prospect.
6. Lead capture and qualification on the spot
Scan the badge, then add three fields: need, timeline, next step. A lead with those three fields is worth ten badge scans without them. Sync to the CRM daily so the office can prepare follow-ups while you are still on the stand.
7. Follow-up within 48 hours and CRM tracking
The first follow-up should reach every qualified lead within two working days, referring to the conversation held on the stand. Then assign each lead an owner and a next action in the CRM. This lever alone separates scenario A from scenario C.
How the stand drives trade show ROI
The stand takes 35 % to 50 % of the budget and it is the lever exhibitors most often get wrong in one of two directions: too little, so nobody stops, or too much decoration and not enough working space, so conversations happen in the aisle.
A stand earns its cost through four functions: being seen from a distance (height, lighting, a clear signature), being entered (open sides, no counter blocking the front), holding a conversation (seating, acoustics, a place to show the product) and being remembered (one strong idea rather than ten messages). Every square metre should serve one of these functions.
| Stand format | Indicative budget | Effect on ROI |
|---|---|---|
| Custom stand | €600 to €1,500 per m² | Designed around your objectives and flow; the format that delivers the highest number of qualified conversations per m² on the shows we build for |
| Double-decker stand | On quotation | Doubles usable area for meetings without renting more floor; suited to large spaces with heavy meeting schedules |
| Turnkey stand | On quotation | Design, build, logistics and dismantling handled by one supplier; frees internal time, which is a real cost line |
| Modular stand | Lower cost per m², no fixed figure | Reusable across several shows; standardised look, less differentiation in a crowded hall |
Within the €600 to €1,500 per m² range, the price of a custom stand moves with the share of built volume, the finishes, lighting and audiovisual, and the amount of storage and meeting space. If you want everything handled by one team from drawing to dismantling, see our turnkey exhibition stand service; if you want to limit fixed costs on a one-off show, exhibition stand rental is an option we can also price.
A real example: a stand built for demonstrations
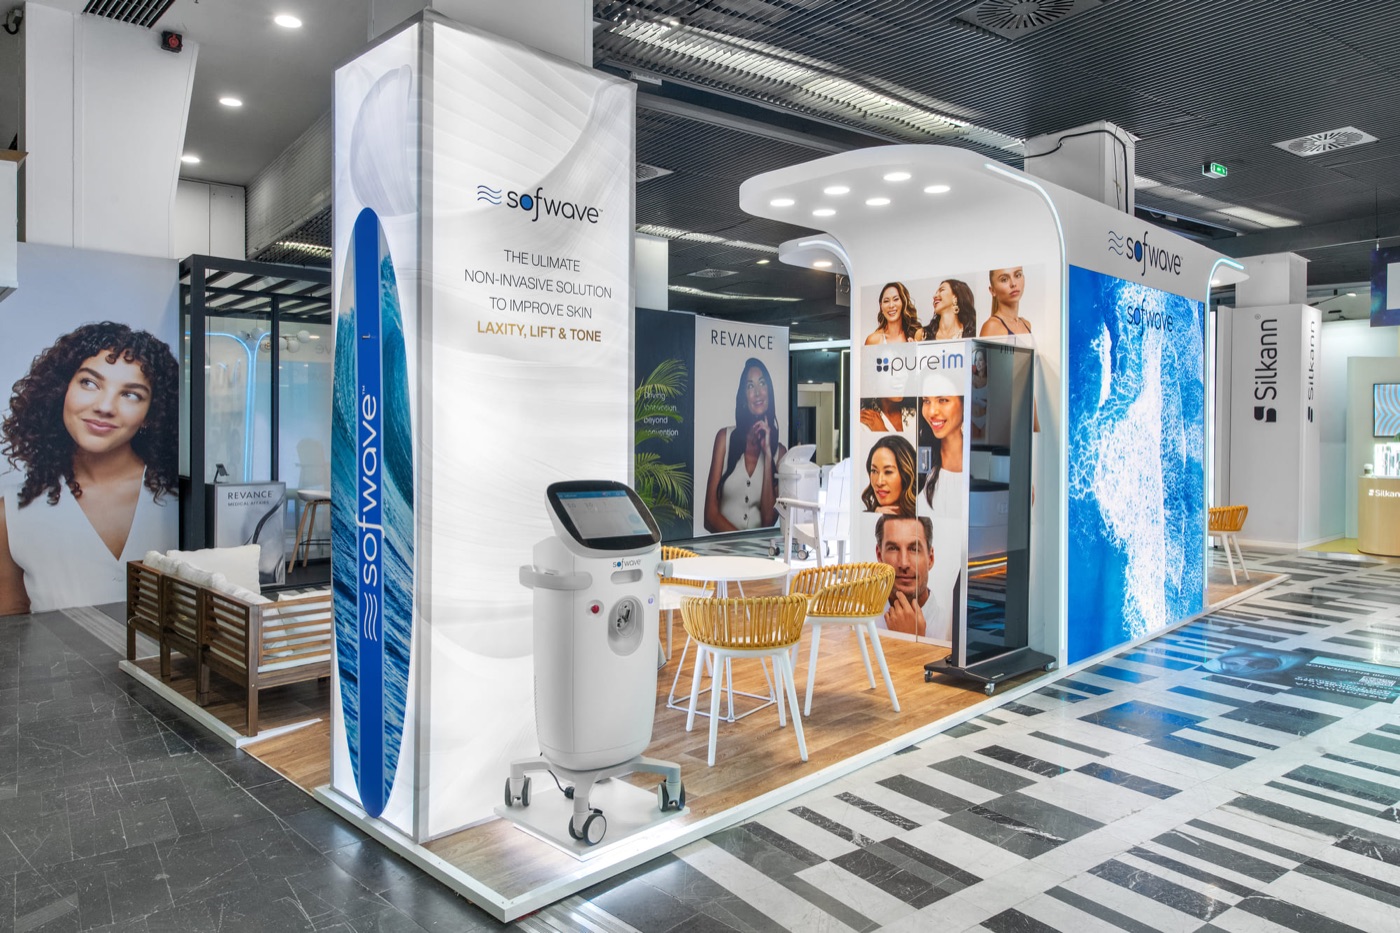
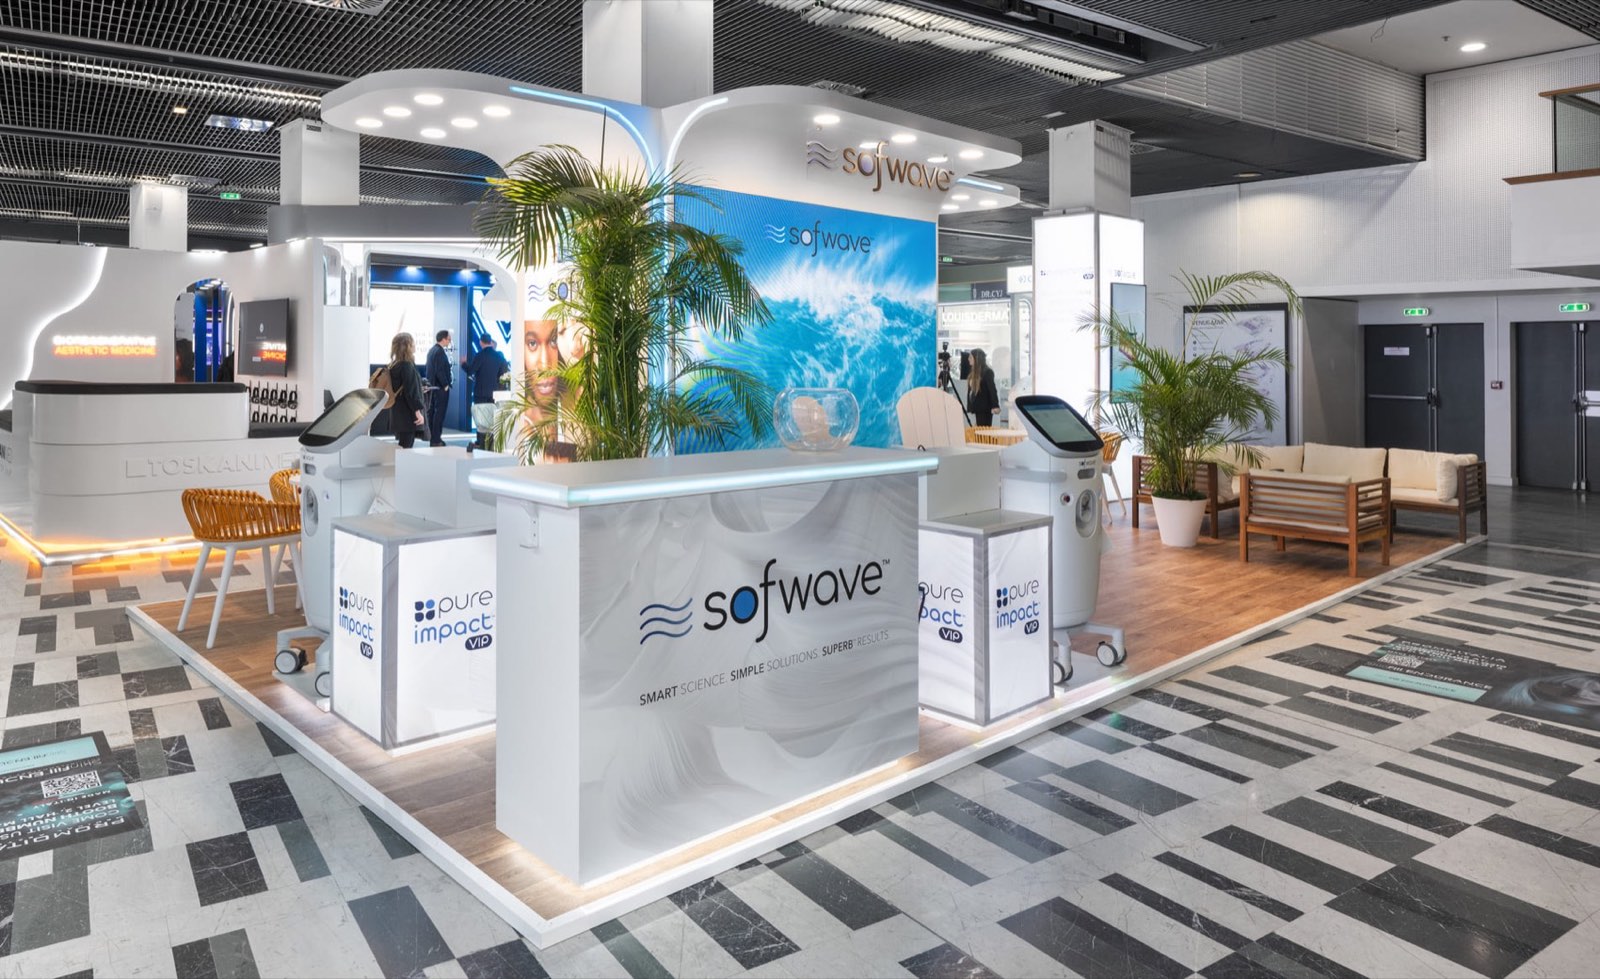
For Sofwave, a manufacturer of aesthetic medicine devices, the objective at its congress was clear: let practitioners see the device in use. We placed the device at the entrance under a white arch with fluid lines, so that each demonstration was visible from the aisle, with a backlit corner totem to signal the stand from a distance. Rattan seats and a wooden bench gave sales staff somewhere to continue the conversation after the demo. The stand did what it was designed for: it put the device in the spotlight and eased demonstrations throughout the congress.
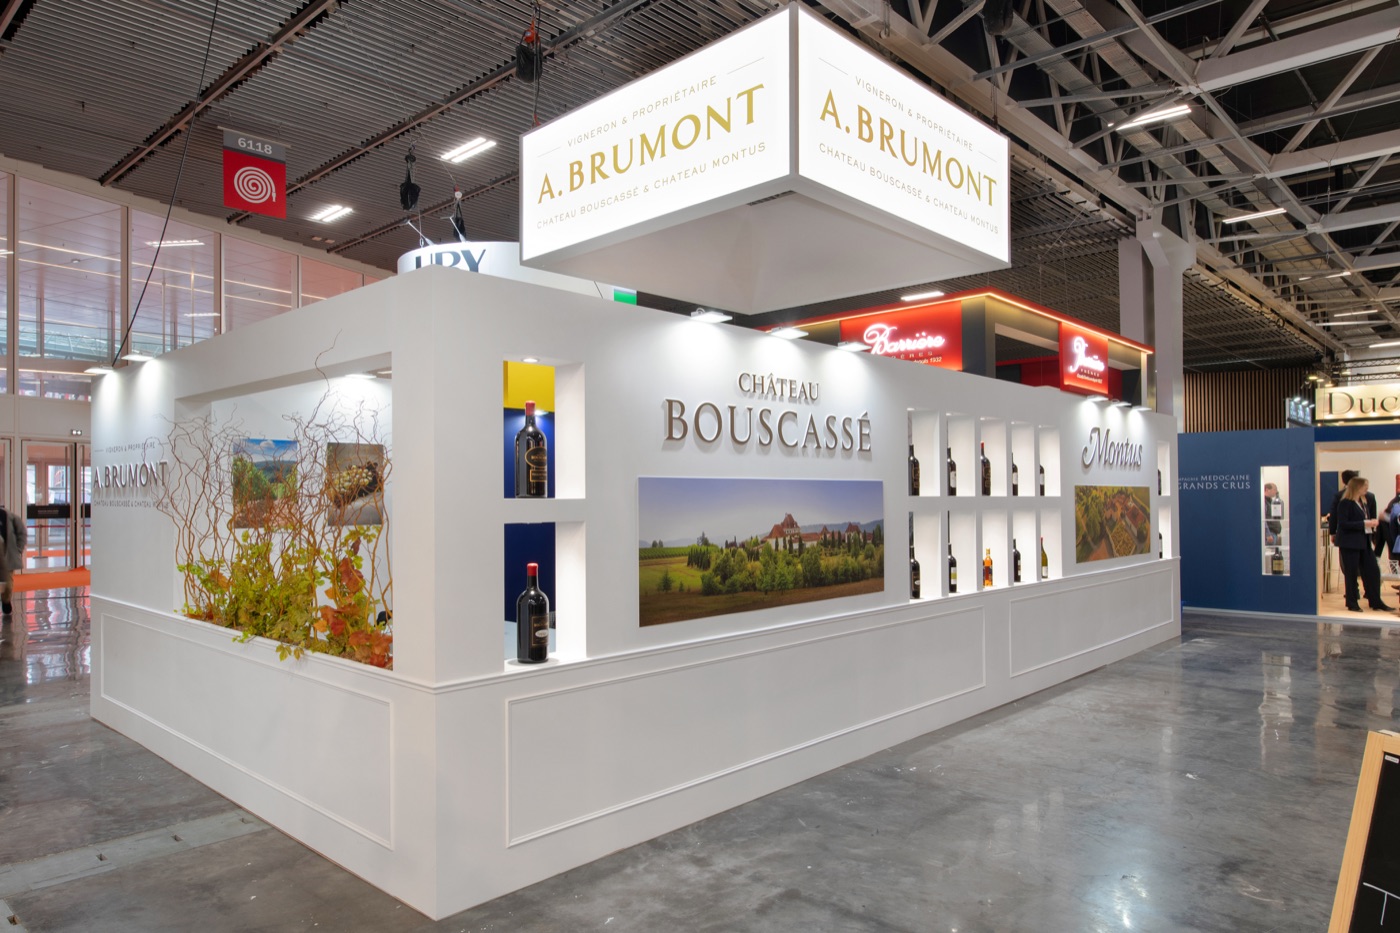
For A. Brumont, a producer of fine wines exhibiting at an international wine fair, the ROI lever was time on stand. A wood-topped tasting bar facing a deep blue wall, backlit niches presenting each cuvée and a suspended illuminated sign visible from afar sustained a steady flow of professionals around the bar for the duration of the fair. Buyers who taste and talk for ten minutes are the ones who place orders.
Both stands were designed from the objective backwards: what has to happen on this stand for the show to pay for itself?
Measuring trade show effectiveness beyond revenue
Revenue takes months to arrive. In the meantime, a handful of indicators tell you whether the show worked, and where to correct next time.
Qualified leads per day and per staff member. The most immediate measure of stand performance. Compare with your target from lever 2.
Meetings held versus meetings booked. A no-show rate above 30 % points to a weak pre-show sequence.
Average conversation length. A stand where conversations last two minutes is a stand where visitors cannot sit down or see the product.
Weighted pipeline at 30 and 90 days. Opportunities opened × probability. The best early proxy for the final ROI.
Follow-up completion rate. Share of qualified leads contacted within 48 hours. If this is below 90 %, the ROI problem is in the office, not on the stand.
Team debrief score. Ask the stand team to rate the show, the stand and visitor quality out of ten on the last evening, while memory is fresh.
Common trade show ROI measurement mistakes
Measuring at the end of the show. B2B deals close months later. A 12-month window, with an interim reading at 3 months, is the minimum.
Counting all badge scans as leads. Cost per lead looks excellent and the conversion rate looks terrible. Qualify on the stand, count only qualified leads.
Leaving costs out. Staff time, travel and post-show work are real. A calculation on space and stand alone overstates ROI by half.
Switching between revenue and margin. A 300 % ROI in one report and 40 % in the next, for the same show, destroys credibility with finance. Pick one basis.
Attributing existing business to the show. Only count what would not have happened otherwise. Renewals already agreed are not show results, however pleasant the conversation on the stand.
Post-show follow-up: where ROI is decided
The show ends on Thursday. ROI is decided the following Monday. A follow-up plan fits on one page:
Day 0, last evening: export the leads, check that need, timeline and next step are filled in, hold a 20-minute team debrief.
Day 1 to 2: personal email or call to every qualified lead, referring to the conversation on the stand and proposing a concrete next step (demo, quote, visit).
Day 3 to 10: second touch for those who have not replied; unqualified contacts go into a nurture sequence, not into the sales pipeline.
Day 30: first pipeline review tagged to the show; interim ROI on weighted pipeline.
Day 90 and day 365: pipeline and invoiced revenue review; final ROI; go / no-go for next year, with the size of the stand as an explicit decision.
For a complete checklist covering the months before the show as well, see our guide to exhibiting at a trade show, and for ideas on filling the stand during the show, how to attract visitors to your stand.
Ready to plan a stand around your ROI?
Decore Studio Events has designed and built custom stands for 25 years: manufacturing is entrusted to selected partner workshops, which we supervise piece by piece, with installations in France and abroad. Tell us your show, your floor space and your objectives in leads and meetings: we will come back with a concept and a detailed quote built around those objectives. Contact the studio.
Further reading
Set your lead and meeting targets first, then brief the stand around them: that order is what separates scenario A from scenario C. If you already know your show and your floor space, we can design the stand that gives those targets the best chance.